
⚡️Hacking the Power System. An End-to-End Machine Learning Project. Part 1: Scope and Data Extraction💡
With this article series, I'll show you how I developed a truly End-to-End DataScience and Machine Learning Project.
Consequently, the project’s main goal is to analyze and model the technical and economic behavior of the Colombian electric power system in an end-to-end project, which involves:
- Data Extraction
- Data Collection from different sources
- Data Transformation
- Data Loading
- Exploratory Data Analysis A.K.A EDA
- Predictive Analysis
- Production Deployment
In this first part, I will explain the project’s scope and the web scraper development. In the second part, I will show you the data transformation and EDA, and in the following parts, I will explain the modeling using time series analysis and machine learning algorithms.
All images were created by the author unless explicitly stated otherwise.
Problem Definition
Basically, the machine learning problem is to forecast the energy price and power demand of Colombia using publicly available messy web and CSV data.
The path to do that, the machine learning, includes several previous steps like the data wrangling and EDA.
Regarding the data, at Kaggle and other resources, like Google’s dataset search, it’s possible to find lots of datasets ready to use in Machine Learning projects.
However, that’s not the way the real world works, usually, the data is dirty and messy, so the Data Scientist must clean it and organize it to put it ready to use in Machine Learning if that’s the case.
In particular, this is a truly End-to-End Project, which has web scrapers, databases, notebooks, machine learning models, Docker images & containers, Cloud Technologies, and a REST API.
Disclaimer: All the data used in this project is publicly available for analysis. Additionally, the model presented in this work is not intended to use in energy trading operations. It was just a learning resource in my path to becoming a Machine Learning Engineer.
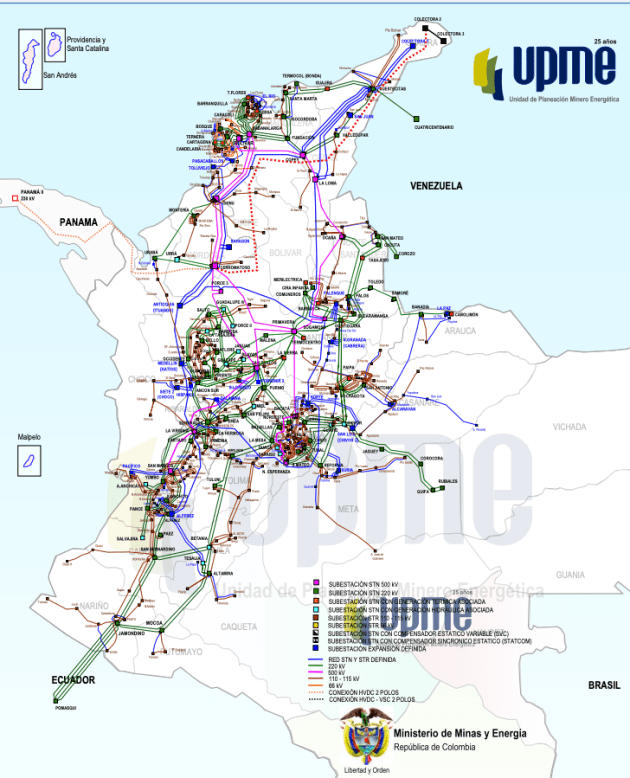
The Colombian Power System
At the end of 2019, Colombia had a net generation capacity of 17,462 MW, where 63.23% was generated using hydraulic power, 29.22% with thermal energy, and 7.55% with no conventional resources like solar, wind, and small hydraulic.
Also, the system has 26.333 km of transmission lines all over the country. Source: XM and UPME.
Data Sources
At my job, sometimes, I have to take a look at the energy prices, one day I realized that I could use this data to build a complete Machine Learning project, so I created a strategy to get that data, process it, and analyze it.
So here the data sources:
- The operator of the interconnected system publishes the electrical system operation report (IDO) daily. They have been doing it consistently, every single day, since October 1, 2013, of course, they have all the history since the system is working, however, this is the public data.
- Every month the operator publishes, in another section of its page, historical electricity prices in CSV and/or XLS files.
- The price of each day is published on the operator’s homepage.
- The daily IDO report is published on the same page where historical operation data can be downloaded.
Note: XM also has a REST API to get the data, however, the goal in this part of the project is to be able to create and deploy a webscraper.
Technology Used
To develop this project, I used the following technologies:
- Python
- Flask
- FastAPI
- Pandas
- Matplotlib
- scikit-learn
- Selenium
- MySQL
- Docker
- Google Cloud Run
- Google Scheduler
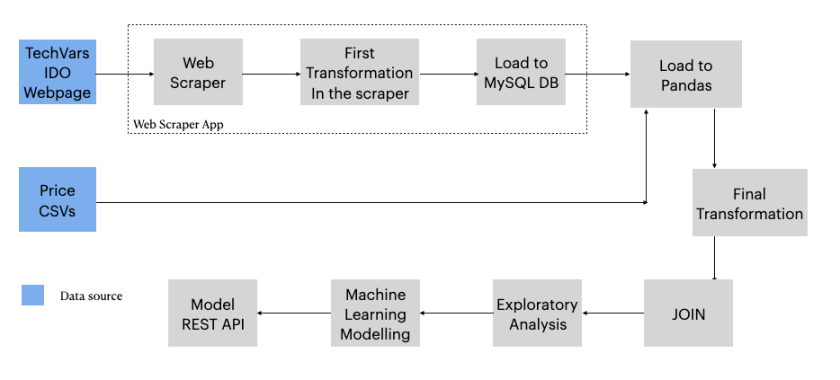
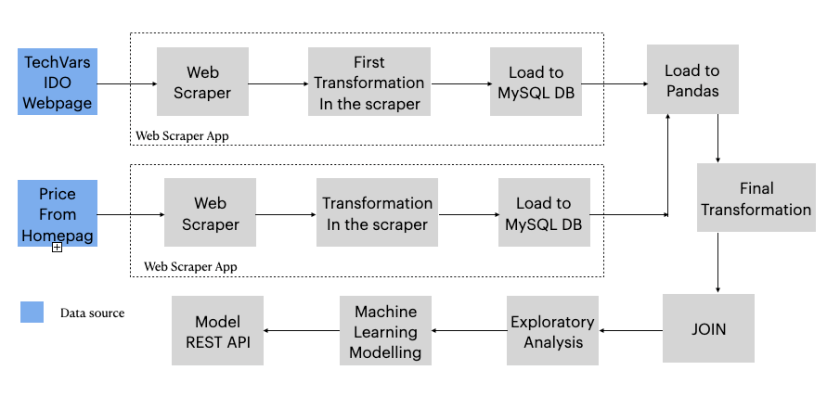
Data Flows
The historical operation data can be queried on the IDO web page, it is just necessary to choose the date and you get the data of that day, this is a Dot Net aspx page that renders the data dynamically using JavaScript. So to get all historical data, you must navigate from 2013.10.01 to the current date minus one.
Consequently, it was necessary to develop a web scraper to get all the historical operation data, then build another scraper, in this case, automated, to scrape the daily data.
The historical prices data is published by the operator almost every month (Sometimes they don’t do it) in CSV files. The daily prices are scraped with an automated scraper too.
Therefore, I designed the data flows for historical and daily data graphically, then implemented each step of it. This part is very important, It’s the plan!
Web Scraper
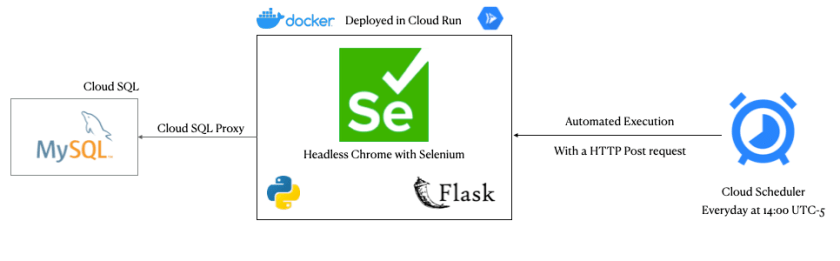
To extract the data from the IDO page, I developed a fully automated web scraper that I wrote in Python and uses Selenium with a headless Chrome engine.
So the scraper is executed with an HTTP POST request, managed by the Flask framework and Google Scheduler cloud service, every day at 2pm in the afternoon.
Admittedly, one of the biggest challenges I had was to deploy it in one of Google’s serverless computing services since not all of them can run Selenium with Chrome in the background.
Therefore, to achieve it I learned how to use Docker, which is a software container system that implements an additional abstraction layer that separates the application and all its dependencies from the operating system.
In conclusion, with my scraper implemented in Docker, it was very easy to deploy it in the Cloud Run service, because if your container works properly on your local computer, it will work just as well in the cloud.
Maybe you wonder why I chose to work with a browser automation program to build my scraper. Well, it’s the easiest way to render JavaScript pages without setting other services, like Splash does for Scrapy.
Indeed, I tried to use Scrapy, however, that framework is not good at manipulating DOM objects automatically like Selenium does. In addition, Scrapy can’t render JavaScript dynamic pages, for that, it is necessary to set a Splash server, which is a headless browser setted up in another web service.
Want some code? Go to: https://github.com/jasantosm/powerco_scraper_daily
The GitHub repository has all the scraper code and the scraped data.
If you need help for your scraper development with Python, contact me. Maybe I could help you.
Sources
To be continued
As I told you above, in the second part I will show you the data transformation and EDA, and in the third and fourth parts, I will explain the modeling using time series analysis and machine learning algorithms.
Stay tuned!